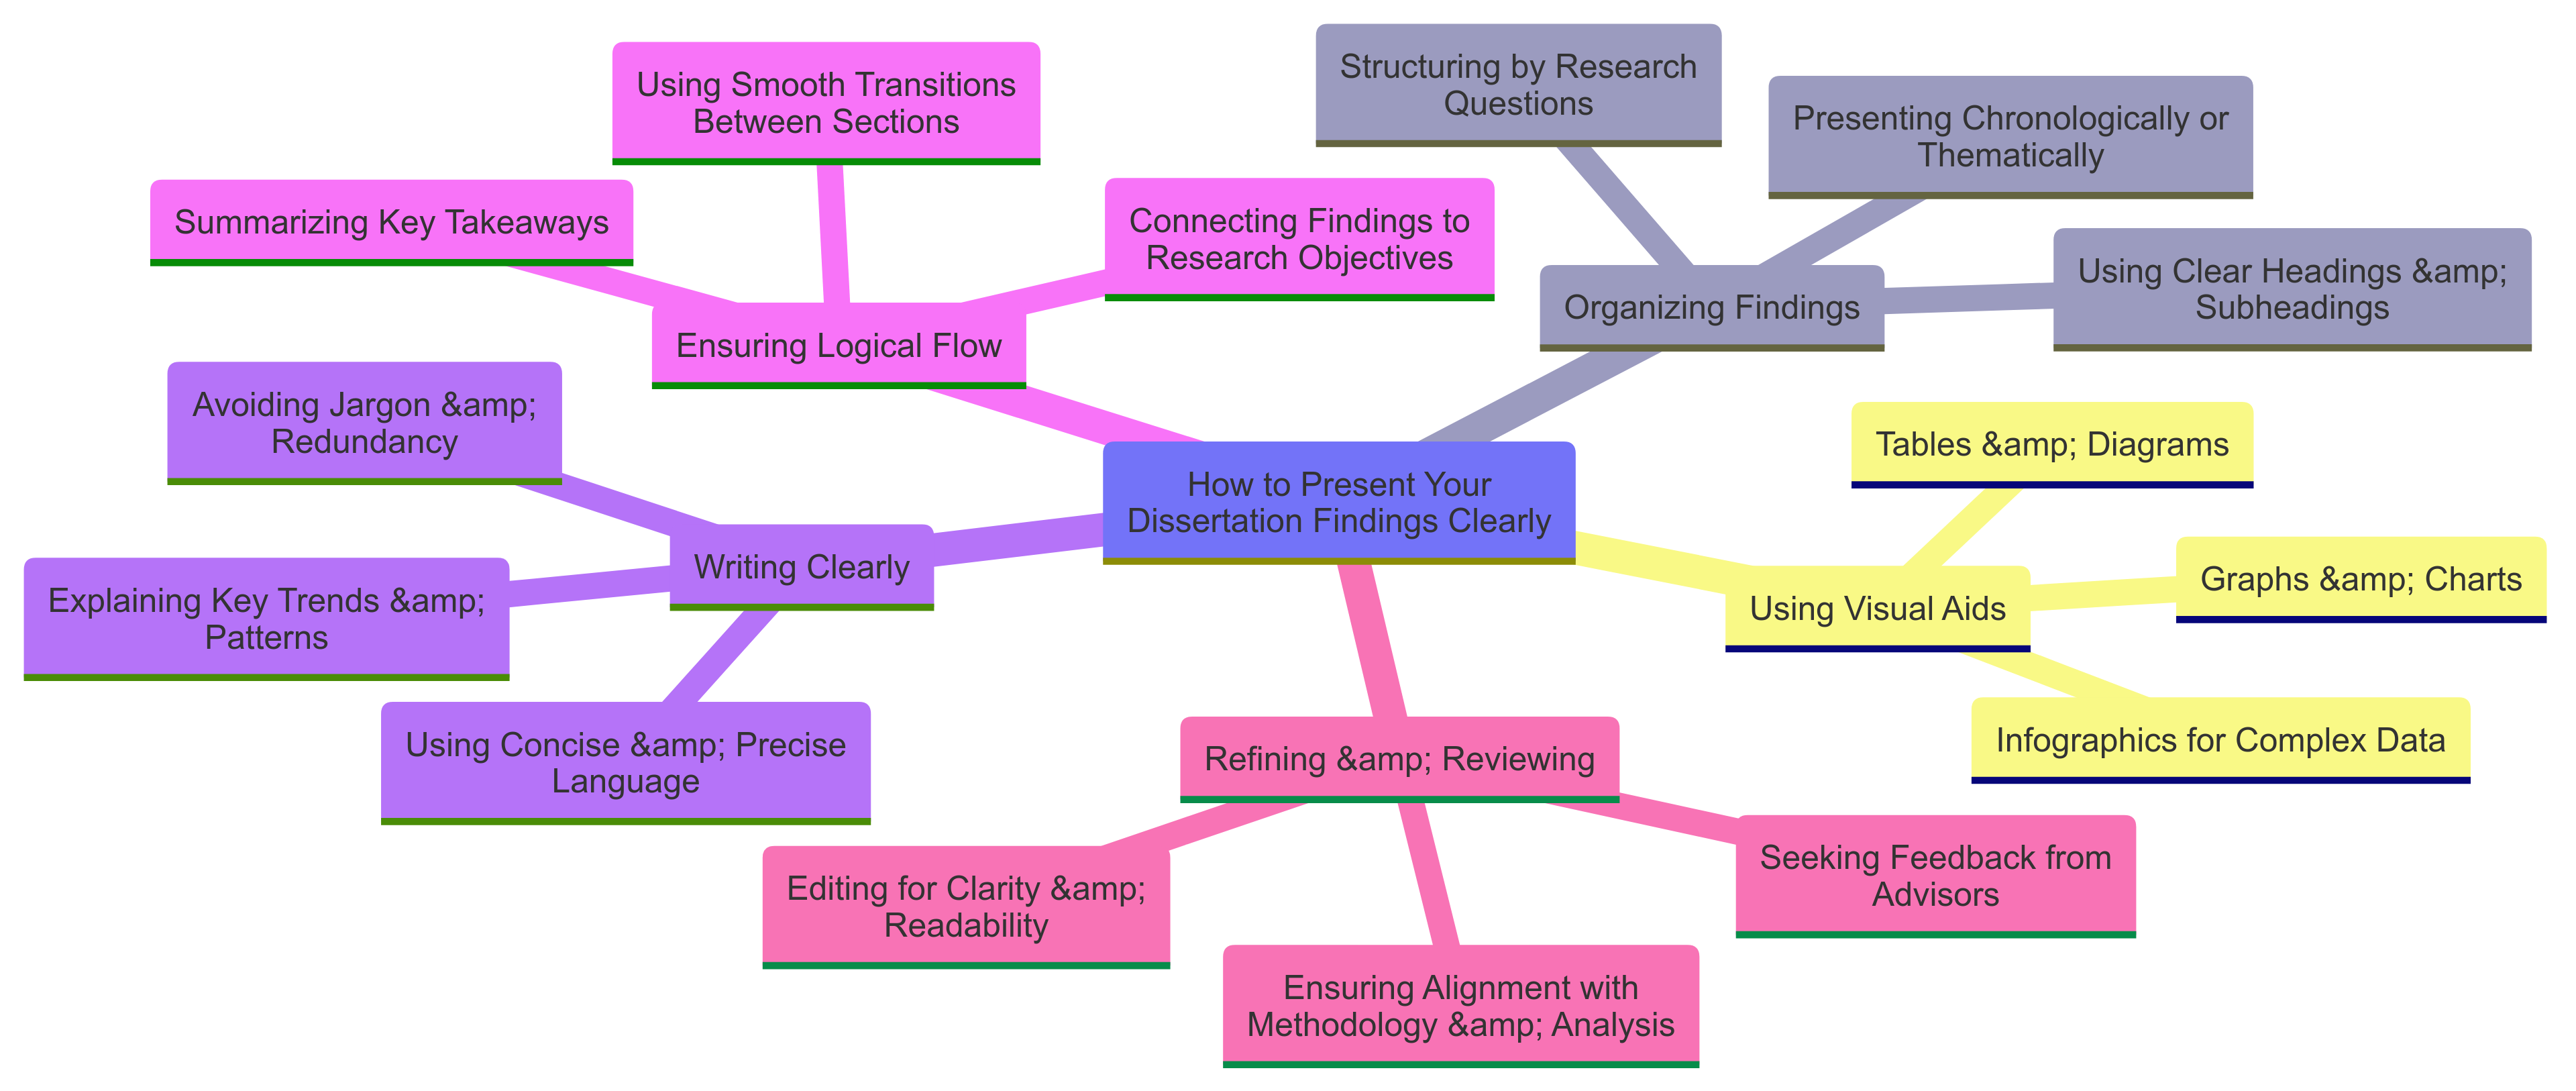
How to Present Your Dissertation Findings Clearly Learn techniques for presenting your findings in a clear, coherent manner, using graphs, tables, and concise writing to ensure your research is accessible and understandable
 : 414
: 414
Presenting your dissertation findings clearly is crucial for ensuring that your research is accessible, engaging, and persuasive. The way you present your data and analysis can significantly impact how your work is understood and appreciated by your audience. From effective data visualization with graphs and tables to concise and coherent writing, every element of your presentation must work together to communicate your key insights. This guide outlines comprehensive strategies for presenting your dissertation findings clearly and coherently, ensuring that your research is both impactful and easy to follow.
1. Understanding the Importance of Clear Presentation
Before diving into techniques, it’s essential to recognize why clear presentation matters:
-
Accessibility:
Clear presentation makes your research accessible not only to experts in your field but also to readers from related disciplines. It allows a broader audience to grasp your contributions. -
Credibility:
A well-organized presentation reflects the rigor and professionalism of your work. When your findings are communicated clearly, it enhances the credibility of your research. -
Engagement:
Effective visual aids and concise writing can capture and maintain the reader’s interest, making your dissertation more compelling and memorable. -
Impact:
The ultimate goal of presenting your findings is to drive home the significance of your research. Clear presentation helps ensure that your conclusions, implications, and recommendations are fully understood and appreciated.
Understanding these benefits sets the stage for adopting strategies that will help you deliver your findings in the most effective manner.
2. Planning Your Presentation Strategy
The foundation of clear presentation lies in careful planning. Before you start drafting your results and discussion chapters, consider the following steps:
A. Identify Your Key Findings
- Prioritize Data:
Review your analysis and identify the most critical findings that answer your research questions or test your hypotheses. - Develop a Narrative:
Think about the story your data tells. Organize your findings in a logical sequence that builds your argument step by step. - Set Objectives:
Determine what you want your readers to understand from each section of your findings. Clear objectives help in structuring your content.
B. Outline Your Results Section
- Logical Structure:
Create an outline that divides your results into subsections (e.g., descriptive statistics, inferential statistics, qualitative themes). Each subsection should address a specific aspect of your research question. - Flow and Transitions:
Plan how you will transition from one section to the next. Effective transitions guide readers through your narrative and maintain coherence.
C. Consider Your Audience
- Expert vs. General Reader:
Tailor your presentation to the knowledge level of your intended audience. While technical details are essential, explain key concepts clearly to ensure that non-specialists can also appreciate your work. - Clarity Over Complexity:
Avoid overloading your text with jargon or overly technical language. Strive for simplicity without compromising academic rigor.
A thoughtful plan ensures that your presentation is organized, focused, and aligned with your research objectives.
3. Writing Clearly and Concisely
Effective writing is at the heart of a clear presentation. The language you use should be precise, direct, and free of unnecessary complexity.
A. Use Concise Language
- Eliminate Redundancy:
Review your text to remove repetitive phrases or information. Every sentence should add value to your argument. - Active Voice:
Write in the active voice wherever possible. For example, “The study found…” is clearer and more direct than “It was found by the study…” - Short Sentences:
Break long, complex sentences into shorter ones. This helps prevent confusion and makes your writing more digestible.
B. Maintain a Logical Flow
- Sequential Order:
Present your findings in a sequence that logically builds your argument. Start with descriptive results, move on to inferential analysis, and then transition into interpretation. - Clear Headings and Subheadings:
Use descriptive headings to demarcate sections of your results. This not only organizes your content but also guides the reader through your analysis. - Signposting:
Use phrases like “first,” “next,” “in addition,” and “finally” to signal transitions between ideas and sections. These signposts help maintain continuity and flow.
C. Focus on Key Messages
- Highlight Main Points:
At the beginning of each section, clearly state the main findings. Summarize these points at the end to reinforce their significance. - Avoid Unnecessary Detail:
Include only the data and analyses that are directly relevant to your research questions. Excess detail can overwhelm your readers and obscure your main points. - Integrate Visuals with Text:
Ensure that your written narrative complements your visual aids. Refer to figures and tables in your text, explaining what each visual represents and why it is important.
Clear and concise writing is essential for ensuring that your dissertation findings are both understandable and engaging.
4. Effective Use of Graphs and Tables
Visual aids such as graphs and tables are powerful tools for presenting data. When used effectively, they can simplify complex information and highlight key trends.
A. Choosing the Right Visual Format
-
Graphs:
Use graphs (e.g., bar charts, line graphs, scatter plots) to illustrate relationships, trends, and comparisons in your data. Choose the graph type that best represents the data. For instance, line graphs are ideal for showing changes over time, while bar charts work well for comparing groups. -
Tables:
Use tables for presenting detailed numerical data. Tables allow readers to see precise values and compare data points directly. Ensure that tables are clearly labeled and formatted for easy reading. -
Figures and Diagrams:
Diagrams, flowcharts, and conceptual models can be used to explain processes, theoretical frameworks, or relationships between variables.
B. Designing Visuals for Clarity
-
Simplicity:
Avoid clutter. Only include essential information in your visuals. A clean, simple design helps readers focus on the key data. -
Labeling:
Ensure that every graph and table has a clear title, labeled axes, and, if necessary, a legend. Readers should be able to understand the visual without referring back to the text. -
Consistency:
Use consistent colors, fonts, and styles across all visuals. This uniformity contributes to the professional appearance of your dissertation. -
Integration:
Embed visuals within the text where they are most relevant. Discuss each visual in your narrative, explaining its significance and how it supports your findings.
Visual aids not only make your dissertation more engaging but also provide a quick reference for readers to grasp complex data.
5. Integrating Narrative and Data
Presenting your findings clearly involves integrating your narrative with your data. The text should not simply describe the visuals; it should interpret them and connect them to your overall argument.
A. Describe Your Findings
- Narrative Overview:
Begin each results section with a summary of the main findings. This overview helps readers understand the context before diving into detailed data. - Interpretation:
After presenting a visual (such as a graph or table), explain what it shows and why it is important. Interpret the data rather than merely describing it.
B. Relate Data to Research Questions
- Direct Connections:
Link your findings directly to your research questions or hypotheses. Explain how the data supports or contradicts your initial assumptions. - Critical Analysis:
Discuss any anomalies or unexpected results. Provide possible explanations for these findings and suggest areas for further investigation.
C. Use Transitions Effectively
- Smooth Flow:
Ensure that transitions between different sets of data and narrative sections are smooth. This might involve summarizing the previous section and introducing the next, highlighting the progression of your argument. - Cohesive Story:
Aim to weave a cohesive story where data and narrative complement each other. A well-integrated presentation reinforces the strength of your conclusions.
A balanced integration of narrative and data ensures that your dissertation is both informative and persuasive.
6. Best Practices for Writing the Results and Discussion Chapters
The results and discussion chapters are where you present and interpret your findings. Adhering to best practices in these sections can greatly enhance the clarity and impact of your work.
A. Results Chapter
- Objective Presentation:
Present your data objectively without inserting personal interpretation. Save discussion and interpretation for the following chapter. - Organized Layout:
Organize results in a logical order. You might structure them according to research questions, hypotheses, or themes. - Visual Integration:
Interweave tables, graphs, and figures throughout the chapter, and ensure that each is referred to and explained in the text. - Concise Summaries:
Conclude each section with a brief summary that encapsulates the main findings.
B. Discussion Chapter
- Interpret Findings:
Discuss the significance of your results in the context of your research questions and the existing literature. Highlight how your findings contribute to your field. - Acknowledge Limitations:
Transparently discuss any limitations in your study and how they might affect the interpretation of your data. - Future Directions:
Suggest areas for further research based on your findings. This not only demonstrates critical thinking but also provides a roadmap for future studies. - Cohesive Narrative:
Ensure that your discussion builds logically on your results and ties back to the broader research objectives outlined in your introduction.
Following these best practices ensures that your results and discussion chapters are well-organized, clearly written, and impactful.
7. Tips for Revision and Final Polishing
After drafting your results and discussion, thorough revision is key to clarity and coherence.
A. Seek Peer and Advisor Feedback
- Constructive Criticism:
Share your drafts with peers and advisors to gather feedback on the clarity and flow of your presentation. - Incorporate Suggestions:
Use the feedback to refine your narrative, clarify your visuals, and ensure that your data is presented logically.
B. Edit for Clarity
- Simplify Complex Sentences:
Revise sentences to eliminate ambiguity and ensure that your findings are communicated directly. - Check Visual Consistency:
Ensure that all graphs, tables, and figures are consistent in style and clearly labeled. - Proofread Thoroughly:
A meticulous proofreading process will help eliminate errors and improve overall readability.
C. Utilize Professional Tools
- Editing Software:
Tools like Grammarly or Hemingway Editor can help improve clarity and readability. - Reference Management:
Ensure all sources are cited correctly, and cross-check that visuals are properly referenced within the text.
A rigorous revision process is the final step in ensuring that your dissertation findings are presented as clearly and effectively as possible.
8. Overcoming Common Pitfalls in Presentation
Even with careful planning, you may encounter obstacles when presenting your findings. Here are some common pitfalls and how to avoid them:
A. Overloading with Data
- Pitfall:
Including too much data can overwhelm readers and obscure your main points. - Solution:
Focus on key findings. Use visual aids to summarize data, and include detailed data in appendices if necessary.
B. Lack of Clarity in Visuals
- Pitfall:
Poorly designed graphs and tables can confuse rather than clarify. - Solution:
Design visuals with simplicity and clarity in mind. Ensure all axes, legends, and titles are clearly labeled and that visuals are integrated seamlessly with the text.
C. Incoherent Narrative
- Pitfall:
Disjointed transitions and a lack of clear organization can leave readers lost. - Solution:
Use a detailed outline and transitional phrases to guide the reader through your argument. Ensure that every section contributes to the overall narrative.
By anticipating and addressing these common pitfalls, you can enhance the overall impact and clarity of your dissertation.
9. Real-Life Examples and Inspiration
Learning from real-life examples can offer practical insights into effective presentation strategies. Consider these examples:
A. Example of a Quantitative Dissertation
In a study examining the effects of social media on academic performance, the researcher organized the results chapter by first presenting descriptive statistics through tables and graphs. Each visual was accompanied by a succinct narrative that explained key trends. In the discussion chapter, the researcher linked these findings back to the literature, providing a coherent argument that was easy to follow.
B. Example of a Qualitative Dissertation
A qualitative dissertation exploring patient experiences in healthcare used thematic charts to display recurring themes from interview data. The narrative interwove direct quotes with summaries of each theme, creating a compelling and relatable discussion. The clear structure helped readers understand the depth and nuance of the findings.
C. Mixed Methods Dissertation
A dissertation that combined survey data with focus group interviews presented quantitative findings in graphs and tables, then followed up with qualitative insights in a separate section. The integrated discussion allowed the researcher to triangulate the data, offering a multi-dimensional view that was both rigorous and accessible.
These examples illustrate that effective presentation is not about the quantity of data presented but about clarity, coherence, and relevance to your central research questions.
10. Final Thoughts: Making Your Dissertation Impactful
Presenting your dissertation findings clearly is the final step in conveying the significance of your research. By organizing your work thoughtfully, using visuals effectively, and writing in a clear and concise manner, you can ensure that your dissertation not only meets academic standards but also resonates with your readers.
Key takeaways include:
-
Plan Thoroughly:
Begin with a detailed outline and clear research objectives. Organize your results in a logical sequence that supports your central argument. -
Focus on Clarity:
Use concise language, clear transitions, and well-designed visual aids to make your findings accessible and understandable. -
Integrate Narrative and Data:
Ensure that your text not only presents data but also interprets and contextualizes it, linking back to your research questions and theoretical framework. -
Revise Rigorously:
Seek feedback from peers and advisors, and be willing to make iterative improvements to enhance clarity and coherence. -
Anticipate Pitfalls:
Avoid overloading your dissertation with excessive data or overly complex visuals. Strive for simplicity and focus.
A well-presented dissertation is a testament to your hard work, critical thinking, and scholarly rigor. It communicates your contributions clearly and leaves a lasting impression on your readers, paving the way for academic recognition and future opportunities.
At DissertationAssist.com, we are dedicated to providing you with the tools, resources, and expert guidance you need to succeed. Whether you need help with organizing your content, creating impactful visuals, or refining your writing style, our support is here to ensure your dissertation makes a maximum impact.
Good luck on your dissertation journey. With careful planning, consistent effort, and a commitment to clarity, your research will shine, and your findings will captivate your audience.