How to Use Statistical Tools in Your Dissertation Research Master statistical tools and software for analyzing data in your dissertation, including tools like SPSS, R, and Excel, to derive meaningful insights from your research
 : 470
: 470
How to Use Statistical Tools in Your Dissertation Research
Statistical tools and software are indispensable assets for any researcher looking to derive meaningful insights from data. Whether you’re testing hypotheses, exploring trends, or validating your research findings, mastering tools like SPSS, R, and Excel can greatly enhance the rigor and clarity of your dissertation. This guide will provide you with a comprehensive framework for integrating statistical analysis into your dissertation research, offering step-by-step strategies, best practices, and tips for selecting and using the right tools for your study.
1. The Importance of Statistical Tools in Dissertation Research
Statistical analysis is not just a means of crunching numbers; it is the process of transforming raw data into actionable insights. In a dissertation, robust data analysis:
-
Validates Your Research:
By applying statistical tests, you can objectively confirm or refute your research hypotheses. This strengthens your arguments and enhances the credibility of your findings. -
Reveals Patterns and Relationships:
Statistical tools help uncover trends, correlations, and causal relationships within your data, providing deeper insights into your research question. -
Informs Decision-Making:
The insights gained from statistical analysis can drive conclusions and recommendations, influencing theory, practice, and future research directions. -
Ensures Objectivity and Precision:
Using statistical methods minimizes bias and allows for replicable results, which are essential for academic integrity. -
Enhances Data Presentation:
Effective use of charts, graphs, and tables derived from statistical software makes your data more accessible and understandable for your readers.
Understanding these benefits will motivate you to invest time in mastering the appropriate statistical tools for your dissertation.
2. Overview of Common Statistical Tools
Different statistical tools serve different purposes, and selecting the right one depends on the nature of your research and data. Here’s a brief overview of three popular tools:
A. SPSS (Statistical Package for the Social Sciences)
-
Purpose:
SPSS is widely used for quantitative data analysis, particularly in the social sciences, psychology, education, and related fields. -
Key Features:
- User-friendly interface with point-and-click functionality
- Comprehensive set of statistical tests (e.g., t-tests, ANOVA, regression analysis)
- Data management features for cleaning and organizing datasets
- Graphical tools for creating charts and visualizations
-
Best Suited For:
Researchers who need to perform complex statistical analyses without extensive programming knowledge.
B. R
-
Purpose:
R is a powerful programming language and environment for statistical computing and graphics. It is favored by researchers in various disciplines for its flexibility and extensive library of packages. -
Key Features:
- Open-source and free to use
- Highly customizable with a vast array of statistical and graphical techniques
- Advanced data manipulation and visualization capabilities
- Strong support for reproducible research through scripts and markdown documents
-
Best Suited For:
Researchers comfortable with coding and seeking a high degree of customization and control over their analyses.
C. Excel
-
Purpose:
Excel is a ubiquitous spreadsheet tool that is widely used for basic data analysis, data management, and creating simple visualizations. -
Key Features:
- Easy-to-use interface for data entry and basic calculations
- Built-in functions for descriptive statistics and simple inferential tests
- Capabilities to create charts and pivot tables
- Useful for preliminary data exploration and small datasets
-
Best Suited For:
Researchers who need to manage and analyze smaller datasets or require a tool for initial data exploration before using more advanced software.
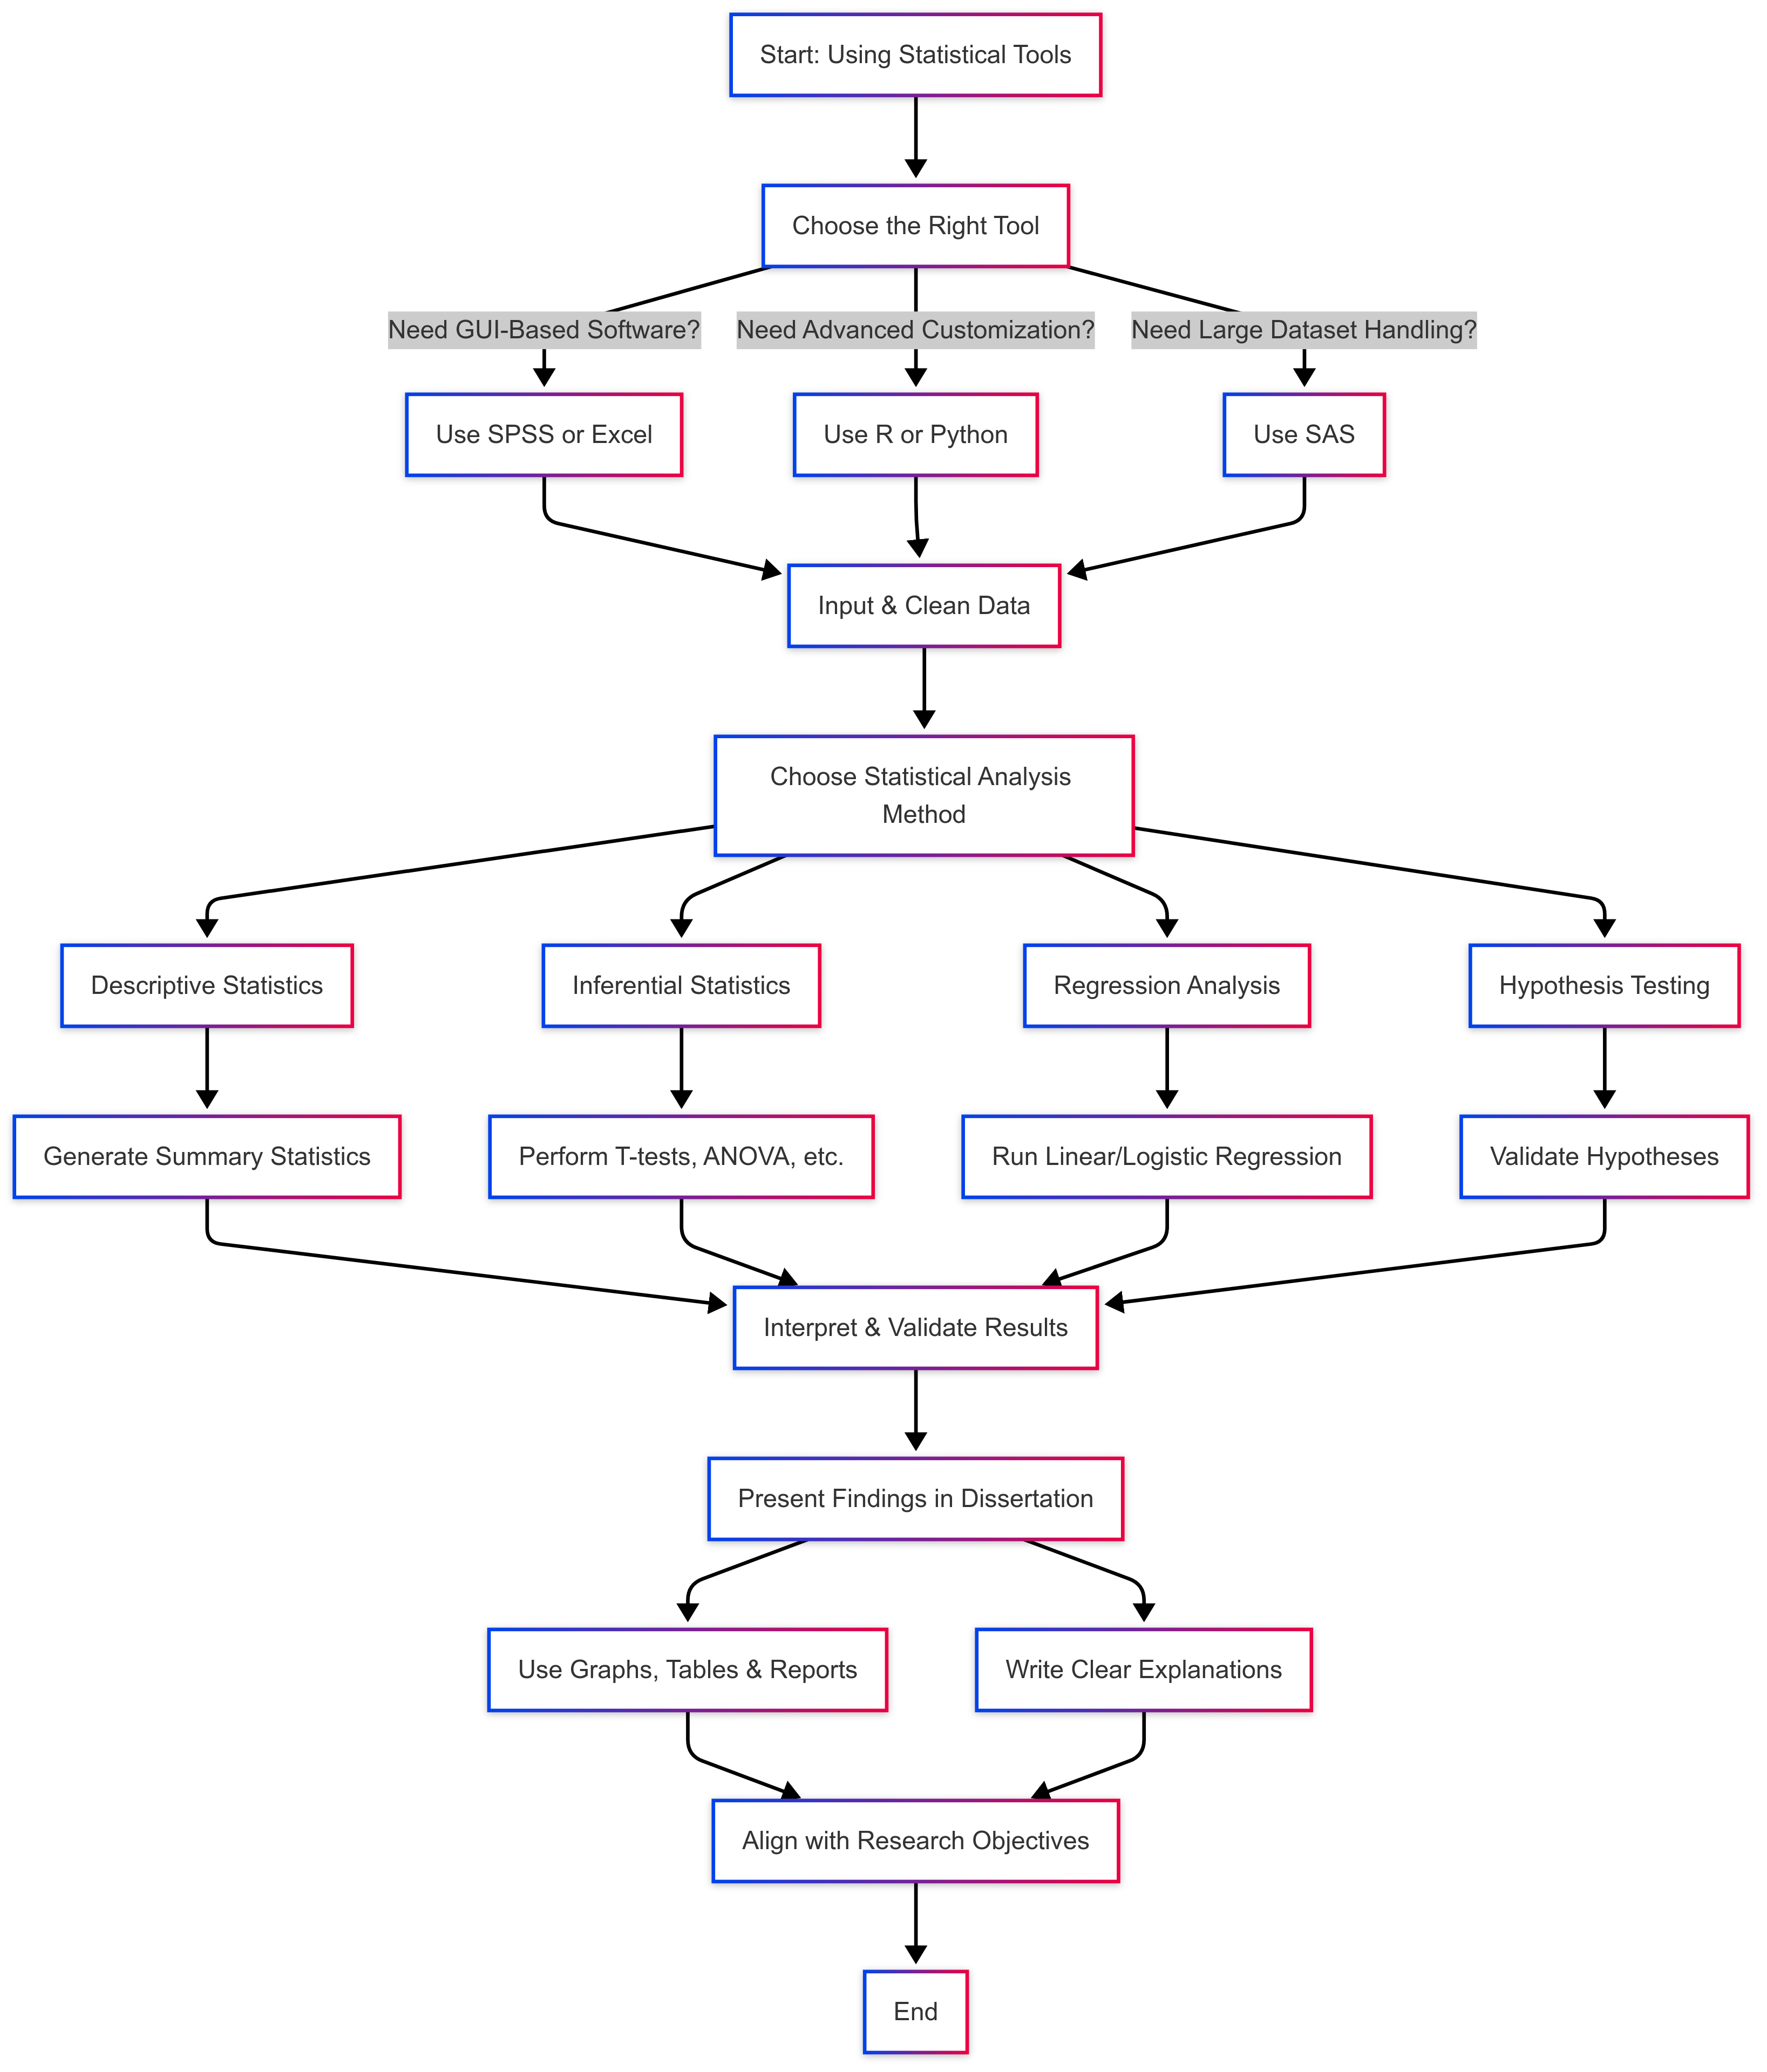
3. Choosing the Right Tool for Your Dissertation
Selecting the appropriate statistical tool depends on several factors:
A. Nature of Your Data and Research Questions
-
Quantitative vs. Qualitative:
If your research involves numerical data and hypothesis testing, SPSS or R might be more appropriate. For exploratory or descriptive analysis with smaller datasets, Excel could be sufficient. -
Complexity of Analysis:
For simple descriptive statistics, Excel often suffices. However, if you require advanced statistical modeling or complex data visualization, R offers more flexibility and power.
B. Your Technical Expertise and Comfort Level
-
User-Friendliness:
SPSS is generally more accessible for users without a programming background. If you’re new to statistical analysis, SPSS can be a good starting point. -
Customization and Flexibility:
If you have coding skills or are willing to invest time in learning, R can provide greater depth and customization options. -
Familiarity:
Many researchers are already familiar with Excel, which makes it a convenient choice for initial data analysis and exploration.
C. Resource Availability
-
Budget:
R is free and open-source, making it an excellent option if you have budget constraints. SPSS and some advanced Excel features, however, may require licenses. -
Institutional Support:
Check what software your institution provides access to. Universities often have licenses for SPSS or offer training sessions for R.
Carefully evaluating these factors will help you decide which tool—or combination of tools—is best suited for your dissertation research.
4. Getting Started with Statistical Tools
Once you’ve chosen a tool, the next step is learning how to use it effectively for your dissertation research. Here are some strategies for getting started with each:
A. Learning SPSS
-
Installation and Setup:
Ensure that SPSS is installed on your computer and that you have access to any necessary modules or add-ons. Familiarize yourself with the interface and basic functionalities. -
Data Import and Management:
Learn how to import data from various sources (e.g., CSV, Excel files) into SPSS. Practice cleaning and organizing your data, including handling missing values and recoding variables. -
Performing Statistical Tests:
Start with basic analyses such as descriptive statistics (means, medians, standard deviations) and progress to more advanced tests like t-tests, ANOVA, and regression analysis. Use SPSS’s point-and-click interface to run these tests and interpret the output. -
Visualizing Data:
Utilize SPSS’s graphing capabilities to create histograms, scatterplots, and bar charts. Experiment with customizing these visualizations to best represent your data. -
Online Resources:
Leverage online tutorials, user guides, and forums dedicated to SPSS. Many universities offer workshops or courses that provide hands-on experience.
B. Learning R
-
Installation and Setup:
Download and install R and, optionally, RStudio, a popular integrated development environment (IDE) that makes R easier to use. Familiarize yourself with the basic syntax and structure of R scripts. -
Basic Data Handling:
Learn how to import data using functions likeread.csv(), and explore data frames, vectors, and lists. Practice manipulating data using packages such asdplyrandtidyr. -
Statistical Analysis:
Start with basic statistical tests (e.g., summary statistics, correlation tests) using built-in functions. Gradually move on to more complex analyses like linear regression, ANOVA, and multivariate analysis using packages likestatsandcar. -
Data Visualization:
Explore R’s powerful visualization libraries, such asggplot2, to create clear and informative graphs. Experiment with different plot types to represent your data effectively. -
Reproducible Research:
Utilize R Markdown to combine code, output, and narrative text in a single document. This practice is invaluable for ensuring that your analyses are transparent and reproducible. -
Online Communities:
Engage with the R community through forums like Stack Overflow and R-bloggers. Numerous tutorials and courses are available online (e.g., Coursera, DataCamp) to help you improve your skills.
C. Learning Excel
-
Data Entry and Organization:
Excel is excellent for data entry and initial data exploration. Learn how to use spreadsheets to organize your data efficiently. -
Basic Statistical Functions:
Familiarize yourself with Excel’s built-in functions for calculating means, medians, standard deviations, and other descriptive statistics. Use pivot tables to summarize and analyze data. -
Data Visualization:
Practice creating charts and graphs in Excel. Learn how to customize these visuals to effectively communicate your findings. -
Add-Ins and Extensions:
Explore Excel add-ins like the Analysis ToolPak, which can provide additional statistical functions for more advanced analysis. -
Online Tutorials:
There are numerous free resources and video tutorials available online to help you master Excel’s statistical functions.
Each tool has a learning curve, but by investing time in tutorials and practice, you can become proficient in using these statistical tools to support your dissertation research.
5. Best Practices for Data Analysis in Your Dissertation
Adopting best practices in data analysis not only improves the quality of your research but also makes your process more efficient and reproducible.
A. Develop a Clear Data Analysis Plan
-
Outline Your Analysis Steps:
Before you begin, create a detailed plan that outlines which statistical tests or analyses you will perform and in what order. This roadmap keeps your work focused and methodical. -
Document Your Process:
Keep a detailed record of every step in your analysis. Documenting your process makes it easier to replicate your study and provides transparency for reviewers and readers.
B. Ensure Data Integrity
-
Data Cleaning:
Invest time in cleaning your data to remove errors, handle missing values, and standardize variable formats. Accurate data is the foundation of reliable analysis. -
Validation:
Validate your data through cross-checks and, if possible, replicate analyses using different software to ensure consistency in your results.
C. Interpret Results Critically
-
Contextualize Your Findings:
Don’t just report statistical results—explain what they mean in the context of your research question and literature review. -
Acknowledge Limitations:
Be transparent about the limitations of your analysis, whether they stem from sample size, measurement error, or methodological constraints. -
Integrate with Theory:
Relate your findings back to your theoretical framework, discussing how your results support, contradict, or extend existing research.
D. Visualize Your Data Effectively
-
Choose the Right Charts:
Use graphs and charts that best represent your data. For example, scatterplots for relationships, histograms for distributions, and bar charts for comparisons. -
Keep Visuals Clear:
Ensure that your visuals are easy to read and understand. Label axes, provide legends, and choose appropriate color schemes to enhance clarity.
Following these best practices will help ensure that your data analysis is rigorous, transparent, and directly contributes to answering your research questions.
6. Interpreting and Presenting Your Findings
Once your data is analyzed, the next step is to interpret and present your findings in a way that is both informative and accessible.
A. Writing the Results Chapter
-
Organize Logically:
Present your results in a logical order that aligns with your research questions or hypotheses. Use subheadings to break down different sections of your analysis. -
Report Statistically:
For quantitative data, report key statistics, including p-values, confidence intervals, and effect sizes. For qualitative data, summarize major themes or patterns. -
Use Visual Aids:
Integrate charts, tables, and graphs to support your written descriptions. Visual aids help readers quickly grasp complex data.
B. Discussion of Findings
-
Interpretation:
In your discussion chapter, interpret what the data means in relation to your research objectives. Explain any surprising trends or deviations from expected outcomes. -
Link to Literature:
Compare your findings with those from the literature review. Highlight where your results confirm or challenge existing theories. -
Implications:
Discuss the broader implications of your findings for your field. Consider practical applications, policy recommendations, and areas for future research.
Presenting your findings in a clear, structured manner is crucial for conveying the significance of your work and ensuring that your conclusions are well-supported by data.
7. Advanced Techniques and Tools
For more complex data analysis, you might explore advanced techniques that can provide deeper insights into your research.
A. Multivariate Analysis
-
Purpose:
Multivariate techniques, such as multiple regression, factor analysis, or cluster analysis, can help uncover relationships between multiple variables simultaneously. -
Implementation:
Tools like SPSS and R have robust functions for conducting multivariate analyses. Ensure you understand the assumptions behind each test and interpret the results within the context of your research.
B. Time-Series and Longitudinal Analysis
-
Purpose:
If your research involves data collected over time, time-series analysis can identify trends, seasonal effects, and cyclical patterns. -
Implementation:
Both R and SPSS offer modules for time-series analysis. Techniques such as ARIMA modeling or moving averages can help forecast trends and evaluate changes over time.
C. Advanced Data Visualization
-
Purpose:
Visualizing complex data effectively can enhance your ability to communicate intricate patterns and trends. -
Implementation:
R’sggplot2package and Excel’s advanced chart features allow for highly customizable visualizations. Consider using interactive visualizations if your dissertation format allows, to provide readers with a dynamic way to explore your data.
8. Troubleshooting Common Challenges
Even with careful planning, challenges in data analysis may arise. Here are some common issues and strategies to address them:
A. Data Quality and Missing Data
-
Challenge:
Incomplete or inaccurate data can distort your analysis. -
Strategy:
Implement thorough data cleaning processes. Use imputation techniques or sensitivity analyses to understand the impact of missing data on your results.
B. Software and Technical Issues
-
Challenge:
Learning new software or troubleshooting errors can be time-consuming. -
Strategy:
Take advantage of online tutorials, user forums, and institutional support. Consider reaching out to peers or technical experts for guidance.
C. Interpretation Difficulties
-
Challenge:
Statistical results can sometimes be ambiguous or difficult to interpret. -
Strategy:
Consult with your advisor or a statistician to help interpret complex results. Cross-validate your findings using different methods to ensure consistency.
By anticipating these challenges and planning strategies to overcome them, you can maintain the integrity and reliability of your data analysis.
9. The Impact of Effective Data Analysis on Your Dissertation
Mastering statistical tools and techniques has far-reaching implications for your dissertation and academic career.
A. Enhancing Research Credibility
- Rigorous Analysis:
A well-executed data analysis demonstrates that your research is grounded in objective, replicable methods. This increases the credibility of your findings among peers and in your field.
B. Informing Critical Decision-Making
-
Evidence-Based Conclusions:
Data-driven insights allow you to draw robust conclusions that can inform future research, policy decisions, and practical applications. -
Strategic Advancements:
Effective data analysis can reveal opportunities for further exploration and innovation, positioning your dissertation as a cornerstone for ongoing academic inquiry.
C. Building Analytical Competence
-
Skill Development:
Mastering statistical tools like SPSS, R, and Excel not only benefits your current dissertation but also builds a skill set that is valuable for your future research and professional endeavors. -
Cross-Disciplinary Applications:
The analytical techniques you learn can be applied across various fields, enhancing your versatility as a researcher.
10. Final Thoughts and Next Steps
The role of data analysis in your dissertation is both foundational and transformative. It is the process by which raw data is converted into meaningful insights that underpin your entire study. By carefully selecting and mastering statistical tools like SPSS, R, and Excel, you equip yourself with the means to rigorously test your hypotheses, reveal significant trends, and articulate your findings in a compelling manner.
Key Takeaways:
-
Understand the Importance:
Recognize that data analysis is not just a technical requirement but a crucial component that validates your research and contributes to your field. -
Plan Thoroughly:
Develop a comprehensive data analysis plan that aligns with your research questions, theoretical framework, and available resources. -
Choose the Right Tools:
Select statistical tools that match your research needs and your technical expertise. Whether it’s the user-friendly interface of SPSS, the flexibility of R, or the accessibility of Excel, each tool has a place in your research arsenal. -
Prepare and Clean Your Data:
Invest time in ensuring your data is accurate, well-organized, and ready for analysis. Data cleaning is an essential step that underpins reliable analysis. -
Interpret and Present Effectively:
Use appropriate statistical techniques to interpret your data, and present your findings clearly through well-designed visuals and structured reporting. -
Address Challenges Proactively:
Anticipate common issues such as data quality problems, software challenges, and interpretation difficulties, and have strategies in place to overcome them. -
Embrace Continuous Learning:
Mastering statistical tools is an iterative process. Regularly update your skills through online courses, workshops, and peer collaborations.
As you move forward with your dissertation, remember that data analysis is a journey—one that requires both technical proficiency and critical thinking. With determination, careful planning, and the right tools at your disposal, you can transform complex data into powerful insights that will make your research stand out.
At DissertationAssist.com, we are committed to providing you with the guidance and resources you need to succeed in your academic journey. Whether you need further assistance with statistical analysis, data visualization, or overall research strategy, our expert advice is here to help.
Good luck on your dissertation journey. May your analyses be robust, your insights profound, and your conclusions impactful.